Grundlæggende statistik
| Institutionelle aktier (lange) | 107.224.695 - 62,78% (ex 13D/G) - change of 3,28MM shares 3,29% MRQ |
| Institutionel værdi (lang) | $ 1.311.387 USD ($1000) |
Institutionelt ejerskab og aktionærer
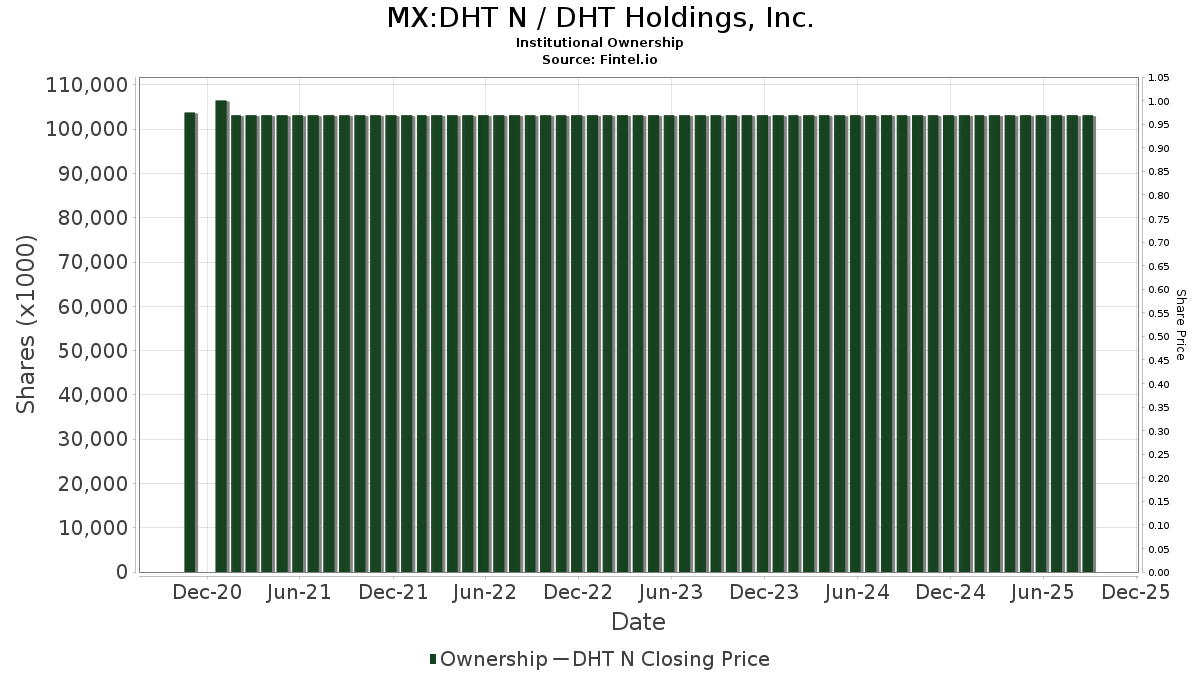
DHT Holdings, Inc. (MX:DHT N) har 270 institutionelle ejere og aktionærer, der har indsendt 13D/G- eller 13F-formularer til Securities Exchange Commission (SEC). Disse institutioner har i alt 107,224,695 aktier. Største aktionærer omfatter Fmr Llc, Dimensional Fund Advisors Lp, DME Capital Management, LP, BlackRock, Inc., American Century Companies Inc, Hosking Partners LLP, Victory Capital Management Inc, Arrowstreet Capital, Limited Partnership, Renaissance Technologies Llc, and State Street Corp .
DHT Holdings, Inc. (BMV:DHT N) institutionel ejerskabsstruktur viser aktuelle positioner i virksomheden efter institutioner og fonde, samt seneste ændringer i positionsstørrelse. Større aktionærer kan omfatte individuelle investorer, investeringsforeninger, hedgefonde eller institutioner. Skema 13D angiver, at investoren besidder (eller besidder) mere end 5 % af virksomheden og har til hensigt (eller har til hensigt at) aktivt at forfølge en ændring i forretningsstrategi. Skema 13G indikerer en passiv investering på over 5%.
Fondens stemningsscore
Fund Sentiment Score (fka Ownership Accumulation Score) finder de aktier, der bliver mest købt af fonde. Det er resultatet af en sofistikeret, multi-faktor kvantitativ model, der identificerer virksomheder med de højeste niveauer af institutionel akkumulering. Scoringsmodellen bruger en kombination af den samlede stigning i oplyste ejere, ændringerne i porteføljeallokeringer i disse ejere og andre målinger. Tallet går fra 0 til 100, hvor højere tal indikerer et højere niveau af akkumulering for sine jævnaldrende, og 50 er gennemsnittet.
Opdateringsfrekvens: Dagligt
Se Ownership Explorer, som giver en liste over højest rangerende virksomheder.
AI+ Ask Fintel’s AI assistant about DHT Holdings, Inc..
Select a question to share a public post with an AI-crafted answer.
Thinking of good questions…
13F og NPORT arkivering
Detaljer om 13F-arkivering er gratis. Detaljer om NP-ansøgninger kræver et premium-medlemskab. Grønne rækker angiver nye positioner. Røde rækker angiver lukkede positioner. Klik på linket ikon for at se den fulde transaktionshistorik.
Opgrader
for at låse premium-data op og eksportere til Excel ![]() .
.
| Fil dato | Kilde | Investor | Type | Gennemsnitlig pris (Øst) |
Aktier | Δ Aktier (%) |
Rapporteret Værdi ($1000) |
Δ Værdi (%) |
Port Alloc (%) |
|
|---|---|---|---|---|---|---|---|---|---|---|
| 2026-02-17 | 13F | Creative Planning | 29.578 | 2,73 | 361 | 4,94 | ||||
| 2026-04-15 | 13F | Valley National Advisers Inc | 1.000 | 0,00 | 0 | |||||
| 2026-02-13 | 13F | Dynamic Technology Lab Private Ltd | 23.644 | -42,79 | 289 | -41,50 | ||||
| 2026-02-11 | 13F | Los Angeles Capital Management Llc | 648 | 8 | ||||||
| 2026-02-17 | 13F | XTX Topco Ltd | 64.401 | -15,73 | 786 | -13,91 | ||||
| 2026-02-13 | 13F | Mariner, LLC | 388.516 | 4,05 | 4.744 | 6,30 | ||||
| 2026-02-13 | 13F | Manufacturers Life Insurance Company, The | 0 | -100,00 | 0 | |||||
| 2026-01-30 | 13F | Glenorchy Capital Ltd | 225.713 | -2,46 | 2.756 | -0,36 | ||||
| 2026-02-11 | 13F | Simplex Trading, Llc | Put | 96.800 | 73,48 | 1.182 | ||||
| 2026-02-11 | 13F | Group One Trading, L.p. | Put | 234.900 | 226,70 | 2.868 | 233,88 | |||
| 2026-02-17 | 13F | Capital Fund Management S.a. | 24.701 | 302 | ||||||
| 2026-04-07 | 13F | Farther Finance Advisors, LLC | 6.902 | 7,29 | 125 | 58,97 | ||||
| 2026-02-11 | 13F | Group One Trading, L.p. | 27.697 | 338 | ||||||
| 2026-02-11 | 13F | Group One Trading, L.p. | Call | 196.100 | 26,60 | 2.394 | 29,34 | |||
| 2026-01-06 | 13F | Sanctuary Advisors, LLC | 0 | -100,00 | 0 | |||||
| 2026-02-11 | 13F | Simplex Trading, Llc | Call | 263.300 | 156,13 | 3.215 | 321.300,00 | |||
| 2025-11-14 | 13F | Wolverine Trading, Llc | Call | 0 | -100,00 | 0 | -100,00 | |||
| 2026-02-11 | 13F | Cerity Partners LLC | 46.706 | -52,72 | 570 | -51,69 | ||||
| 2026-02-17 | 13F | Gotham Asset Management, LLC | 157.878 | 25,31 | 1.928 | 28,04 | ||||
| 2026-02-12 | 13F | Rossby Financial, LCC | 26.000 | 7,88 | 317 | 11,23 | ||||
| 2026-02-13 | 13F | Caitong International Asset Management Co., Ltd | 194 | -63,53 | 2 | -66,67 | ||||
| 2026-02-20 | 13F | Sunbelt Securities, Inc. | 5.084 | 1,34 | 62 | 5,08 | ||||
| 2026-02-17 | 13F | Ameriprise Financial Inc | 686.190 | 189,35 | 8.375 | 195,59 | ||||
| 2026-02-18 | 13F | Vident Advisory, LLC | 48.620 | 0,14 | 594 | 2,24 | ||||
| 2025-11-14 | 13F | Petrus Trust Company, LTA | 0 | -100,00 | 0 | |||||
| 2026-04-20 | 13F | Ronald Blue Trust, Inc. | 591 | 457,55 | 11 | 900,00 | ||||
| 2026-02-17 | 13F | DME Capital Management, LP | 7.366.664 | -3,34 | 89.947 | -1,23 | ||||
| 2026-02-11 | 13F | Ameritas Investment Partners, Inc. | 10.652 | 130 | ||||||
| 2026-02-17 | 13F | Capstone Investment Advisors, Llc | 13.295 | -68,95 | 162 | -68,30 | ||||
| 2026-02-17 | 13F | Jones Financial Companies Lllp | 536 | 78,67 | 7 | 100,00 | ||||
| 2026-04-22 | 13F | Sterling Capital Management LLC | 4.484 | -89,72 | 82 | -84,77 | ||||
| 2026-02-09 | 13F | Jackson Creek Investment Advisors LLC | 135.212 | 2 | ||||||
| 2026-04-15 | 13F | Monument Capital Management | 13.286 | -3,14 | 243 | 44,91 | ||||
| 2026-03-09 | 13F | EMC Capital Management | 9.086 | -15,00 | 0 | |||||
| 2026-02-05 | 13F | Td Private Client Wealth Llc | 154 | 71,11 | 2 | 0,00 | ||||
| 2026-02-17 | 13F | Manatuck Hill Partners, LLC | 175.000 | 2.137 | ||||||
| 2026-01-15 | 13F | Nisa Investment Advisors, Llc | 1.579 | -43,18 | 19 | -42,42 | ||||
| 2026-02-17 | 13F | Harvey Capital Management Inc | 202.950 | 2,40 | 2.478 | 4,65 | ||||
| 2026-02-13 | 13F | Victory Capital Management Inc | 3.008.679 | 1,52 | 36.736 | 3,72 | ||||
| 2026-02-17 | 13F | Quadrature Capital Ltd | 11.084 | 135 | ||||||
| 2026-02-13 | 13F | American Century Companies Inc | 5.016.012 | -5,00 | 61.246 | -2,93 | ||||
| 2026-02-17 | 13F | Advisor Group Holdings, Inc. | 32.449 | -11,77 | 396 | -10,00 | ||||
| 2026-02-06 | 13F | HighTower Advisors, LLC | 21.861 | 0,07 | 267 | 1,92 | ||||
| 2026-02-13 | 13F | Neuberger Berman Group LLC | 59.456 | 452,26 | 726 | 466,41 | ||||
| 2026-02-17 | 13F | Optiver Holding B.V. | 801 | -14,15 | 10 | -18,18 | ||||
| 2026-02-13 | 13F | Pinnacle Wealth Planning Services, Inc. | 789 | 10 | ||||||
| 2026-02-17 | 13F | Two Sigma Investments, Lp | 0 | -100,00 | 0 | |||||
| 2026-02-12 | 13F | Summit Financial, LLC | 119.438 | 0,94 | 1.458 | 3,11 | ||||
| 2026-02-13 | 13F | Beck Capital Management, Llc | 0 | -100,00 | 0 | |||||
| 2026-02-17 | 13F | CastleKnight Management LP | 1.167.866 | 8,08 | 14.260 | 10,42 | ||||
| 2026-02-17 | 13F | CastleKnight Management LP | Call | 200.000 | -71,43 | 2.442 | -70,81 | |||
| 2026-02-17 | 13F | Northern Trust Corp | 1.183.916 | -7,22 | 14.456 | -5,20 | ||||
| 2026-01-21 | 13F | Sound Income Strategies, LLC | 4.409 | 58 | ||||||
| 2026-02-17 | 13F | Citadel Advisors Llc | Call | 164.000 | 120,13 | 2.002 | 124,94 | |||
| 2026-02-12 | 13F | Federated Hermes, Inc. | 1.716 | -36,77 | 21 | -37,50 | ||||
| 2026-02-17 | 13F | Citadel Advisors Llc | 1.006.243 | 320,14 | 12.286 | 329,28 | ||||
| 2026-04-21 | 13F | PharVision Advisers, LLC | 0 | -100,00 | 0 | |||||
| 2026-02-17 | 13F | Citadel Advisors Llc | Put | 71.700 | 5,75 | 875 | 8,02 | |||
| 2026-02-10 | 13F/A | Northwestern Mutual Wealth Management Co | 420 | 5 | ||||||
| 2026-02-17 | 13F | Voloridge Investment Management, Llc | 359.843 | 214,31 | 4.394 | 221,13 | ||||
| 2025-11-05 | 13F | Alps Advisors Inc | 0 | -100,00 | 0 | |||||
| 2026-02-10 | 13F | Ellevest, Inc. | 24.932 | -9,34 | 304 | -7,32 | ||||
| 2026-02-11 | 13F | LPL Financial LLC | 14.631 | -82,23 | 179 | -81,91 | ||||
| 2026-02-13 | 13F | Arrowstreet Capital, Limited Partnership | 2.478.875 | 33,48 | 30.267 | 36,39 | ||||
| 2026-02-17 | 13F | Millennium Management Llc | 214.495 | 322,88 | 2.619 | 332,01 | ||||
| 2026-02-05 | 13F | Allworth Financial LP | 927 | 417,88 | 11 | 450,00 | ||||
| 2026-04-20 | 13F | Longview Financial Advisors, Inc. | 180 | 3 | ||||||
| 2026-02-19 | 13F | CI Private Wealth, LLC | 24.031 | 4,90 | 285 | 4,03 | ||||
| 2026-01-23 | 13F | Rsm Us Wealth Management Llc | 22.667 | -1,18 | 275 | 0,36 | ||||
| 2026-04-16 | 13F | Baron Wealth Management LLC | 14.750 | 4,18 | 269 | 56,40 | ||||
| 2026-04-14 | 13F | Congress Asset Management Co /ma | 481.918 | 16,65 | 8.805 | 74,54 | ||||
| 2026-02-06 | 13F | Covestor Ltd | 29 | 20,83 | 0 | |||||
| 2026-02-10 | 13F | Envestnet Asset Management Inc | 50.741 | 61,79 | 620 | 65,51 | ||||
| 2026-01-29 | 13F | Atlas Legacy Advisors, LLC | Call | 15.000 | 183 | |||||
| 2025-11-14 | 13F | ExodusPoint Capital Management, LP | 0 | -100,00 | 0 | -100,00 | ||||
| 2026-01-30 | 13F | State of New Jersey Common Pension Fund D | 0 | -100,00 | 0 | |||||
| 2026-02-17 | 13F | Integrated Advisors Network LLC | 0 | -100,00 | 0 | |||||
| 2026-02-17 | 13F | Nomura Holdings Inc | 13.774 | -54,34 | 168 | -53,33 | ||||
| 2026-02-10 | 13F | Goldman Sachs Group Inc | 1.837.738 | -20,32 | 22.439 | -18,58 | ||||
| 2026-02-13 | 13F | First Trust Advisors Lp | 234.853 | 27,41 | 2.868 | 30,20 | ||||
| 2026-01-30 | 13F | Kiker Wealth Management, LLC | 0 | -100,00 | 0 | |||||
| 2026-02-10 | 13F | Savant Capital, LLC | 19.083 | 28,88 | 233 | 32,39 | ||||
| 2026-02-12 | 13F | Dividend Asset Capital, Llc | 28.859 | -36,66 | 352 | -35,29 | ||||
| 2026-02-10 | 13F | Bnp Paribas Arbitrage, Sa | 94.019 | -61,05 | 1.148 | -60,23 | ||||
| 2026-02-12 | 13F | Integrated Quantitative Investments LLC | 39.584 | 483 | ||||||
| 2026-02-06 | 13F | ProShare Advisors LLC | 24.718 | 13,37 | 302 | 15,77 | ||||
| 2026-02-13 | 13F | Prudential Financial Inc | 0 | -100,00 | 0 | |||||
| 2026-02-12 | 13F | Campbell & CO Investment Adviser LLC | 173.487 | -13,08 | 2.118 | -11,19 | ||||
| 2025-11-14 | 13F | Skopos Labs, Inc. | 0 | -100,00 | 0 | |||||
| 2026-02-10 | 13F | Sfmg, Llc | 19.015 | 0,00 | 232 | 2,20 | ||||
| 2026-02-13 | 13F | Toroso Investments, LLC | 64.720 | -18,15 | 790 | -16,31 | ||||
| 2026-02-12 | 13F | BlackRock, Inc. | 7.046.215 | 5,60 | 86.034 | 7,90 | ||||
| 2025-11-14 | 13F | PointState Capital LP | 0 | -100,00 | 0 | |||||
| 2026-02-17 | 13F | Energy Income Partners, LLC | 153.441 | 1,33 | 1.874 | 3,54 | ||||
| 2025-11-06 | 13F | Compagnie Lombard Odier SCmA | Call | 0 | -100,00 | 0 | -100,00 | |||
| 2026-04-23 | 13F | J.w. Cole Advisors, Inc. | 20.687 | 0,17 | 378 | 52,63 | ||||
| 2026-02-17 | 13F | Susquehanna International Group, Llp | 409.403 | 713,49 | 4.999 | 731,61 | ||||
| 2025-11-12 | 13F | Headlands Technologies LLC | 0 | -100,00 | 0 | |||||
| 2026-02-17 | 13F | Susquehanna International Group, Llp | Put | 1.539.700 | 80,23 | 18.800 | 84,16 | |||
| 2026-02-11 | 13F | 111 Capital | 0 | -100,00 | 0 | -100,00 | ||||
| 2026-02-27 | 13F | Strategic Investment Solutions, Inc. /IL | 250 | 0,00 | 3 | 50,00 | ||||
| 2026-04-06 | 13F | Versant Capital Management, Inc | 1.303 | 17,49 | 24 | 76,92 | ||||
| 2025-11-06 | 13F | Ameritas Advisory Services, LLC | 0 | -100,00 | 0 | -100,00 | ||||
| 2026-01-29 | 13F | IMC-Chicago, LLC | 18.160 | -54,35 | 222 | -53,47 | ||||
| 2026-02-17 | 13F | Public Employees Retirement System Of Ohio | 132.697 | 3.692,43 | 1.620 | 3.851,22 | ||||
| 2026-01-29 | 13F | IMC-Chicago, LLC | Put | 77.700 | 99,74 | 949 | 104,31 | |||
| 2026-02-17 | 13F | Susquehanna International Group, Llp | Call | 1.754.500 | 130,25 | 21.422 | 135,28 | |||
| 2026-01-29 | 13F | IMC-Chicago, LLC | Call | 119.300 | 107,12 | 1.457 | 111,63 | |||
| 2026-02-17 | 13F | Two Sigma Advisers, Lp | 53.000 | -27,60 | 647 | -25,97 | ||||
| 2026-02-03 | 13F | SBI Securities Co., Ltd. | 9.373 | -29,78 | 114 | -28,30 | ||||
| 2026-02-13 | 13F | Sei Investments Co | 263.228 | 90,29 | 3.214 | 94,43 | ||||
| 2025-11-14 | 13F | Encompass Capital Advisors LLC | 0 | -100,00 | 0 | |||||
| 2026-02-13 | 13F | Boston Partners | 235.451 | -9,62 | 2.875 | -7,68 | ||||
| 2026-02-17 | 13F | Tcw Group Inc | 343.276 | -10,30 | 4.191 | -8,33 | ||||
| 2026-04-08 | 13F | Wealth Enhancement Advisory Services, Llc | 28.814 | 20,38 | 538 | 87,11 | ||||
| 2026-02-10 | 13F | Intech Investment Management Llc | 50.409 | 10,73 | 615 | 13,05 | ||||
| 2026-02-17 | 13F | Russell Investments Group, Ltd. | 418.560 | -10,56 | 5.111 | -8,62 | ||||
| 2026-02-09 | 13F | Harbour Investments, Inc. | 7.237 | 16,03 | 88 | 18,92 | ||||
| 2026-02-12 | 13F | Hrt Financial Lp | 89.788 | -4,64 | 1 | 0,00 | ||||
| 2026-02-13 | 13F | Charles Schwab Investment Management Inc | 336.991 | 5,73 | 4.115 | 8,04 | ||||
| 2026-02-13 | 13F | Oceanic Investment Management LTD | 0 | -100,00 | 0 | |||||
| 2026-02-13 | 13F | Smartleaf Asset Management LLC | 11.794 | 1.533,52 | 143 | 1.687,50 | ||||
| 2025-11-07 | 13F | Sierra Ocean, Llc | 0 | -100,00 | 0 | |||||
| 2026-01-30 | 13F | Us Bancorp \de\ | 764 | 0,00 | 9 | 0,00 | ||||
| 2026-02-09 | 13F | MQS Management LLC | 0 | -100,00 | 0 | |||||
| 2026-02-03 | 13F | International Assets Investment Management, Llc | 53.628 | 3,08 | 655 | 16,58 | ||||
| 2026-02-06 | 13F | Pnc Financial Services Group, Inc. | 3.671 | -1,34 | 45 | 0,00 | ||||
| 2025-11-14 | 13F | Corton Capital Inc. | 0 | -100,00 | 0 | |||||
| 2026-02-09 | 13F | Jefferies Financial Group Inc. | Put | 31.400 | -72,70 | 383 | -72,13 | |||
| 2026-02-02 | 13F | Fifth Third Bancorp | 6.766 | 62,68 | 83 | 67,35 | ||||
| 2026-02-09 | 13F | Jefferies Financial Group Inc. | 21.684 | -72,09 | 265 | -71,55 | ||||
| 2026-04-23 | 13F | SJS Investment Consulting Inc. | 21 | 600,00 | 0 | |||||
| 2026-02-06 | 13F | Tortoise Investment Management, LLC | 0 | -100,00 | 0 | |||||
| 2026-01-21 | 13F | Flagship Harbor Advisors, Llc | 350 | 4 | ||||||
| 2026-02-06 | 13F | Axxcess Wealth Management, Llc | 30.226 | 13 | ||||||
| 2026-02-12 | 13F | Renaissance Technologies Llc | 2.327.845 | -17,55 | 28.423 | -15,76 | ||||
| 2026-02-17 | 13F | D. E. Shaw & Co., Inc. | 0 | -100,00 | 0 | |||||
| 2026-02-17 | 13F | Schonfeld Strategic Advisors LLC | 88.259 | 1.078 | ||||||
| 2026-02-17 | 13F | Tower Research Capital LLC (TRC) | 9.685 | 27,97 | 118 | 31,11 | ||||
| 2026-02-13 | 13F | Stifel Financial Corp | 14.828 | -6,87 | 181 | -4,74 | ||||
| 2026-02-13 | 13F | Citigroup Inc | 137.619 | -28,90 | 1.680 | -27,37 | ||||
| 2026-02-03 | 13F | Ethic Inc. | 37.751 | -3,62 | 461 | -1,71 | ||||
| 2025-11-14 | 13F | Wolverine Trading, Llc | 29.156 | 351 | ||||||
| 2025-11-14 | 13F | Wolverine Trading, Llc | Put | 65.000 | 22,41 | 782 | 33,28 | |||
| 2026-02-13 | 13F | Barclays Plc | 256.544 | 10,40 | 3.132 | 12,82 | ||||
| 2026-02-17 | 13F | Jain Global LLC | 16.928 | 40,73 | 207 | 44,06 | ||||
| 2026-02-17 | 13F | Wellington Management Group Llp | 11.040 | 0,00 | 135 | 2,29 | ||||
| 2026-02-17 | 13F | Royal Bank Of Canada | 81.025 | 291,61 | 989 | 300,40 | ||||
| 2026-02-09 | 13F | Geode Capital Management, Llc | 1.686.074 | 4,94 | 20.587 | 7,22 | ||||
| 2026-02-17 | 13F | Mirabella Financial Services Llp | 17.892 | 218 | ||||||
| 2026-02-17 | 13F | Prelude Capital Management, Llc | 327.621 | 3,23 | 4.000 | 5,49 | ||||
| 2026-04-15 | 13F | FNY Investment Advisers, LLC | 28.700 | 1 | ||||||
| 2026-02-17 | 13F | Caption Management, LLC | Call | 19.000 | 0,00 | 232 | 1,76 | |||
| 2026-02-12 | 13F | Voya Investment Management Llc | 23.452 | 0,00 | 286 | 2,14 | ||||
| 2026-04-07 | 13F | CoreCap Advisors, LLC | 15.798 | 289 | ||||||
| 2026-02-13 | 13F | Verition Fund Management LLC | 51.400 | -5,66 | 628 | -3,69 | ||||
| 2026-02-17 | 13F | Tudor Investment Corp Et Al | 811.795 | 183,61 | 9.912 | 189,82 | ||||
| 2026-02-13 | 13F | Walleye Trading LLC | Put | 237.100 | 471,33 | 2.895 | 484,65 | |||
| 2026-02-13 | 13F | Walleye Trading LLC | Call | 245.800 | 167,76 | 3.001 | 173,56 | |||
| 2026-02-06 | 13F | Legato Capital Management LLC | 39.584 | 483 | ||||||
| 2026-02-09 | 13F | GeoSphere Capital Management | 155.000 | 1.893 | ||||||
| 2026-02-13 | 13F | Walleye Trading LLC | 994 | -96,29 | 12 | -96,24 | ||||
| 2026-04-22 | 13F | Janney Montgomery Scott LLC | 61.232 | 358,63 | 1 | |||||
| 2026-01-30 | 13F | Pekin Hardy Strauss, Inc. | 23.500 | -16,07 | 287 | -14,37 | ||||
| 2026-02-12 | 13F | Aviva Plc | 37.593 | -5,43 | 459 | -3,37 | ||||
| 2025-10-30 | 13F | Universal- Beteiligungs- und Servicegesellschaft mbH | 0 | -100,00 | 0 | -100,00 | ||||
| 2026-01-29 | 13F | UBS Group AG | 728.348 | 43,62 | 8.893 | 46,75 | ||||
| 2026-02-17 | 13F | Qube Research & Technologies Ltd | 1.869.249 | 7,92 | 22.824 | 10,27 | ||||
| 2026-02-13 | 13F | Martingale Asset Management L P | 211.965 | 29,67 | 2.588 | 32,51 | ||||
| 2026-02-17 | 13F | Mercer Global Advisors Inc /adv | 18.025 | 18,27 | 220 | 20,88 | ||||
| 2026-02-19 | 13F | Invesco Ltd. | 157.295 | -21,71 | 1.921 | -20,00 | ||||
| 2026-02-10 | 13F | Quantbot Technologies LP | 110.319 | 1.347 | ||||||
| 2026-02-11 | 13F | Empowered Funds, LLC | 729.649 | 9,63 | 8.909 | 12,02 | ||||
| 2026-04-24 | 13F | Root Financial Partners, LLC | 381 | 7 | ||||||
| 2026-02-17 | 13F | Aster Capital Management (DIFC) Ltd | 0 | -100,00 | 0 | |||||
| 2026-02-12 | 13F | Nuveen, LLC | 757.224 | 15,45 | 9.246 | 17,97 | ||||
| 2026-02-12 | 13F | Cibc World Markets Corp | 0 | -100,00 | 0 | |||||
| 2026-02-13 | 13F | Marshall Wace, Llp | 0 | -100,00 | 0 | |||||
| 2025-11-14 | 13F | Teza Capital Management LLC | 0 | -100,00 | 0 | |||||
| 2026-02-12 | 13F | New York State Common Retirement Fund | 34.043 | 0,00 | 416 | 2,22 | ||||
| 2025-11-13 | 13F | FIL Ltd | 0 | -100,00 | 0 | |||||
| 2026-02-13 | 13F | State Street Corp | 2.269.460 | 0,76 | 27.710 | 2,96 | ||||
| 2026-01-23 | 13F | Assetmark, Inc | 126 | 0,00 | 2 | 0,00 | ||||
| 2026-02-05 | 13F | Thrivent Financial For Lutherans | 314.946 | 82,93 | 4 | 50,00 | ||||
| 2026-02-12 | 13F | Xponance, Inc. | 10.520 | 128 | ||||||
| 2025-11-07 | 13F | Shell Asset Management Co | 0 | -100,00 | 0 | |||||
| 2026-01-26 | 13F | Cwm, Llc | 29.591 | 24,35 | 0 | |||||
| 2026-01-27 | 13F/A | Capital Performance Advisors Llp | 11.672 | 2,28 | 143 | 4,41 | ||||
| 2026-02-06 | 13F | EverSource Wealth Advisors, LLC | 3.671 | 21,72 | 45 | 22,22 | ||||
| 2026-02-13 | 13F | Healthcare Of Ontario Pension Plan Trust Fund | 99.166 | 1.211 | ||||||
| 2026-02-13 | 13F | Y-Intercept (Hong Kong) Ltd | 127.425 | 1.556 | ||||||
| 2026-02-17 | 13F | Bank Of America Corp /de/ | 442.159 | -48,05 | 5.399 | -46,92 | ||||
| 2026-02-17 | 13F | State Of Wisconsin Investment Board | 27.612 | 8,23 | 337 | 10,86 | ||||
| 2026-01-28 | 13F | Ruffer LLP | 358.738 | 4.387 | ||||||
| 2026-02-13 | 13F | Police & Firemen's Retirement System of New Jersey | 35.169 | -0,54 | 429 | 1,66 | ||||
| 2026-02-06 | 13F | Larson Financial Group LLC | 1.704 | 7,92 | 21 | 11,11 | ||||
| 2026-02-09 | 13F | HBK Sorce Advisory LLC | 0 | -100,00 | 0 | -100,00 | ||||
| 2025-11-14 | 13F | Bayesian Capital Management, LP | 0 | -100,00 | 0 | |||||
| 2026-02-10 | 13F | Bank of New York Mellon Corp | 364.120 | 1,66 | 4.446 | 3,88 | ||||
| 2026-02-12 | 13F | Triumph Capital Management | 200 | 2 | ||||||
| 2026-02-13 | 13F | Jacobs Levy Equity Management, Inc | 731.103 | 8.927 | ||||||
| 2025-11-14 | 13F | Cubist Systematic Strategies, LLC | 86.589 | 1.035 | ||||||
| 2025-11-13 | 13F | Vestcor Inc | 0 | -100,00 | 0 | |||||
| 2026-04-22 | 13F | 1492 Capital Management LLC | 0 | -100,00 | 0 | |||||
| 2026-02-06 | 13F | Lsv Asset Management | 923.904 | -2,15 | 11 | 0,00 | ||||
| 2026-04-02 | 13F | Ares Financial Consulting, LLC | 1.791 | 32 | ||||||
| 2026-02-13 | 13F | Ieq Capital, Llc | 114.527 | 27,18 | 1.398 | 29,93 | ||||
| 2026-02-17 | 13F | Mangrove Partners | 17.367 | 212 | ||||||
| 2026-03-31 | 13F | Sankala Group LLC | 273 | 0,00 | 5 | -20,00 | ||||
| 2026-02-12 | 13F | Counterpoint Mutual Funds LLC | 41.679 | 509 | ||||||
| 2026-02-17 | 13F | Clear Street Markets Llc | 1.500 | 18 | ||||||
| 2026-02-17 | 13F | Quantinno Capital Management LP | 39.225 | 64,82 | 479 | 68,31 | ||||
| 2026-04-21 | 13F | Hosking Partners LLP | 3.511.617 | -2,27 | 64.157 | 46,24 | ||||
| 2026-02-11 | 13F | O'shaughnessy Asset Management, Llc | 139.931 | 1,35 | 1.709 | 3,58 | ||||
| 2026-02-12 | 13F | Marex Group plc | 1.084.752 | 5.860,18 | 13.245 | 6.003,23 | ||||
| 2026-02-13 | 13F | Squarepoint Ops LLC | 87.203 | 25,73 | 1.065 | 28,50 | ||||
| 2026-02-06 | 13F | Global Retirement Partners, LLC | 0 | -100,00 | 0 | |||||
| 2026-02-17 | 13F | MIRAE ASSET GLOBAL ETFS HOLDINGS Ltd. | 62.852 | 6,10 | 767 | 8,49 | ||||
| 2026-02-17 | 13F | Algert Global Llc | 0 | -100,00 | 0 | |||||
| 2026-04-24 | 13F | KC Investment Advisors, LLC | 51.607 | -18,57 | 943 | 21,86 | ||||
| 2026-02-14 | 13F | Rockefeller Capital Management L.P. | 6.105 | 1.121,00 | 6 | 20,00 | ||||
| 2026-04-15 | 13F | Bayforest Capital Ltd | 7.414 | -75,46 | 135 | -63,32 | ||||
| 2026-02-13 | 13F | Quarry LP | 2.209 | -46,20 | 27 | -46,94 | ||||
| 2026-02-17 | 13F | Lazard Asset Management Llc | 443.328 | -0,79 | 5.413 | 1,39 | ||||
| 2026-01-14 | 13F | Hennion & Walsh Asset Management, Inc. | 11.005 | 134 | ||||||
| 2026-02-11 | 13F | Jpmorgan Chase & Co | 507.912 | 105,27 | 6.202 | 109,78 | ||||
| 2026-02-13 | 13F | SRS Capital Advisors, Inc. | 200 | -97,15 | 2 | -97,59 | ||||
| 2026-02-17 | 13F | Point72 Asset Management, L.P. | 222.404 | 2.716 | ||||||
| 2026-04-20 | 13F | State of Alaska, Department of Revenue | 41.145 | 0,00 | 1 | |||||
| 2025-11-21 | 13F/A | CIBC Bancorp USA Inc. | 13.592 | 162 | ||||||
| 2026-02-17 | 13F | Interval Partners, LP | 0 | -100,00 | 0 | |||||
| 2026-02-17 | 13F | California State Teachers Retirement System | 8.329 | 4,61 | 102 | 6,32 | ||||
| 2026-02-17 | 13F | Alliancebernstein L.p. | 141.580 | 0,00 | 1.729 | 2,19 | ||||
| 2026-02-05 | 13F | Bessemer Group Inc | 29 | -71,84 | 0 | |||||
| 2025-11-13 | 13F | Hsbc Holdings Plc | 0 | -100,00 | 0 | |||||
| 2026-02-13 | 13F | Parkside Financial Bank & Trust | 148 | 0,00 | 2 | 0,00 | ||||
| 2026-02-12 | 13F | Wealthspire Advisors, LLC | 0 | -100,00 | 0 | |||||
| 2026-02-12 | 13F | Dimensional Fund Advisors Lp | 10.424.634 | -1,96 | 127.284 | 0,17 | ||||
| 2026-02-17 | 13F | Aquatic Capital Management LLC | 2.291 | 28 | ||||||
| 2026-04-13 | 13F | IFP Advisors, Inc | 658 | -15,53 | 12 | 33,33 | ||||
| 2026-02-17 | 13F | Susquehanna Fundamental Investments, Llc | 51.356 | -3,45 | 627 | -1,26 | ||||
| 2026-02-17 | 13F | Polymer Capital Management (US) LLC | 29.106 | 125,77 | 355 | 130,52 | ||||
| 2026-04-21 | 13F | Founders Capital Management | 1.000 | -50,00 | 18 | -25,00 | ||||
| 2026-02-12 | 13F | Jane Street Group, Llc | 1.117.054 | 109,61 | 13.639 | 114,18 | ||||
| 2026-02-13 | 13F | Segall Bryant & Hamill, Llc | 92.250 | 1.126 | ||||||
| 2026-02-11 | 13F | Deutsche Bank Ag\ | 108.157 | 4,23 | 1.321 | 6,54 | ||||
| 2025-10-27 | 13F | Belvedere Trading LLC | Put | 0 | -100,00 | 0 | ||||
| 2026-02-11 | 13F | CSM Advisors, LLC | 62.259 | 17,29 | 1 | |||||
| 2026-02-12 | 13F | Jane Street Group, Llc | Put | 439.400 | -7,40 | 5.365 | -5,38 | |||
| 2025-10-27 | 13F | Belvedere Trading LLC | 0 | -100,00 | 0 | |||||
| 2026-02-12 | 13F | Jane Street Group, Llc | Call | 57.900 | 70,80 | 707 | 74,32 | |||
| 2026-02-13 | 13F | Peak6 Llc | 39.460 | 482 | ||||||
| 2026-02-17 | 13F | Boothbay Fund Management, Llc | 49.822 | 608 | ||||||
| 2026-02-17 | 13F | Engineers Gate Manager LP | 236.213 | 163,17 | 2.884 | 169,03 | ||||
| 2026-04-15 | 13F | Redhawk Wealth Advisors, Inc. | 11.656 | 4,19 | 213 | 55,88 | ||||
| 2026-02-17 | 13F | Lighthouse Investment Partners, LLC | 89.052 | -44,74 | 1.087 | -43,53 | ||||
| 2026-02-17 | 13F | Bank Of America Corp /de/ | Put | 0 | -100,00 | 0 | ||||
| 2026-02-13 | 13F | Peak6 Llc | Call | 400 | 5 | |||||
| 2026-04-13 | 13F | GoalVest Advisory LLC | 92.653 | -17,19 | 1.693 | 23,87 | ||||
| 2026-02-10 | 13F | Castlekeep Investment Advisors Llc | 132.528 | 0,00 | 1.618 | 2,21 | ||||
| 2026-04-17 | 13F | CENTRAL TRUST Co | 16.173 | 0,00 | 295 | 49,75 | ||||
| 2026-02-06 | 13F | Leonteq Securities AG | 4.851 | 36,15 | 59 | 40,48 | ||||
| 2026-01-20 | 13F | Sullivan Wood Capital Management LLC | 36.450 | 32,79 | 445 | 35,67 | ||||
| 2026-04-22 | 13F | Stone House Investment Management, LLC | 109 | 2 | ||||||
| 2026-02-02 | 13F | Oppenheimer & Co Inc | 0 | -100,00 | 0 | |||||
| 2026-02-13 | 13F | Public Sector Pension Investment Board | 0 | -100,00 | 0 | |||||
| 2026-04-21 | 13F | Financial Consulate, Inc | 16 | 0,00 | 0 | |||||
| 2026-04-07 | 13F | Signaturefd, Llc | 5.110 | 125,01 | 93 | 244,44 | ||||
| 2026-02-11 | 13F | Vise Technologies, Inc. | 0 | -100,00 | 0 | |||||
| 2026-04-24 | 13F | Raiffeisen Bank International AG | 77.266 | 17,24 | 1.412 | 76,38 | ||||
| 2026-02-12 | 13F | CIBC Private Wealth Group, LLC | 1.000 | -11,74 | 12 | -7,69 | ||||
| 2026-02-13 | 13F | Wells Fargo & Company/mn | 169.596 | 45,30 | 2.071 | 48,49 | ||||
| 2026-02-17 | 13F | BTG Pactual Asset Management US LLC | 205.782 | 2.513 | ||||||
| 2026-02-09 | 13F | Bleakley Financial Group, LLC | 50.281 | 5,27 | 614 | 7,54 | ||||
| 2026-02-17 | 13F | Aqr Capital Management Llc | 545.855 | 42,65 | 6.665 | 45,76 | ||||
| 2026-02-17 | 13F | Dark Forest Capital Management Lp | 0 | -100,00 | 0 | |||||
| 2026-02-06 | 13F | Gsa Capital Partners Llp | 154.496 | -20,95 | 2 | -50,00 | ||||
| 2026-04-13 | 13F | True Wealth Design, LLC | 462 | -5,33 | 8 | 60,00 | ||||
| 2026-02-13 | 13F | Financial Network Wealth Advisors LLC | 81 | 0,00 | 1 | |||||
| 2026-04-21 | 13F | Wasatch Advisors Inc | 0 | -100,00 | 0 | |||||
| 2026-02-09 | 13F | Legal & General Group Plc | 25.229 | 0,18 | 308 | 2,67 | ||||
| 2026-02-17 | 13F | Scientech Research LLC | 11.644 | 142 | ||||||
| 2026-02-10 | 13F | State of Wyoming | 51.336 | 21,41 | 627 | 23,96 | ||||
| 2026-02-17 | 13F | Lombard Odier Asset Management (USA) Corp | 12.147 | -71,48 | 148 | -70,87 | ||||
| 2026-01-12 | 13F | Roble, Belko & Company, Inc | 0 | -100,00 | 0 | |||||
| 2026-02-13 | 13F | Macquarie Group Ltd | 0 | -100,00 | 0 | |||||
| 2026-01-27 | 13F | WealthCollab, LLC | 48 | 0,00 | 1 | |||||
| 2026-02-13 | 13F | Ubs Asset Management Americas Inc | 279 | 3 | ||||||
| 2025-11-13 | 13F | Entropy Technologies, LP | 0 | -100,00 | 0 | |||||
| 2026-04-24 | 13F | UMA Financial Services, Inc. | 53 | 0,00 | 1 | |||||
| 2026-02-17 | 13F | Price T Rowe Associates Inc /md/ | 76.466 | 12,38 | 1 | |||||
| 2026-04-24 | 13F | Acorn Financial Advisory Services Inc /adv | 718.271 | 13.123 | ||||||
| 2026-02-06 | 13F/A | Rathbone Brothers plc | 10.250 | 125 | ||||||
| 2025-11-10 | 13F | Citigroup Inc | Call | 0 | -100,00 | 0 | -100,00 | |||
| 2026-04-06 | 13F | GAMMA Investing LLC | 4.273 | 18,73 | 78 | 81,40 | ||||
| 2026-01-16 | 13F | Empirical Financial Services, LLC d.b.a. Empirical Wealth Management | 48.240 | 589 | ||||||
| 2026-02-13 | 13F | Kestra Advisory Services, LLC | 0 | -100,00 | 0 | |||||
| 2026-02-13 | 13F | Diametric Capital, LP | 50.186 | 613 | ||||||
| 2026-02-11 | 13F | Fox Run Management, L.l.c. | 13.753 | -59,40 | 168 | -58,66 | ||||
| 2026-02-13 | 13F | Cynosure Management, Llc | 0 | -100,00 | 0 | -100,00 | ||||
| 2026-02-17 | 13F | Raymond James Financial Inc | 236.339 | -10,31 | 2.886 | -8,38 | ||||
| 2026-02-12 | 13F | Quadrant Capital Group Llc | 184 | 0,00 | 2 | 0,00 | ||||
| 2026-02-12 | 13F | State Board Of Administration Of Florida Retirement System | 43.621 | -71,98 | 533 | -71,40 | ||||
| 2026-02-13 | 13F | Walleye Capital LLC | Call | 73.700 | 160,42 | 900 | 165,98 | |||
| 2026-04-14 | 13F | Drive Wealth Management, Llc | 10.234 | -1,95 | 187 | 46,46 | ||||
| 2026-02-13 | 13F | Walleye Capital LLC | Put | 144.700 | 311,08 | 1.767 | 320,48 | |||
| 2026-02-13 | 13F | Walleye Capital LLC | 191 | 114,61 | 2 | 100,00 | ||||
| 2026-04-13 | 13F | Massmutual Trust Co Fsb/adv | 230 | -8,37 | 4 | 33,33 | ||||
| 2026-02-17 | 13F | Perbak Capital Partners LLP | 32.073 | -71,61 | 392 | -71,04 | ||||
| 2026-02-10 | 13F | Acadian Asset Management Llc | 83.416 | -44,81 | 1 | 0,00 | ||||
| 2026-02-17 | 13F | Trexquant Investment LP | 0 | -100,00 | 0 | |||||
| 2026-01-28 | 13F | Gentry Private Wealth, Llc | 34.306 | -21,38 | 419 | -19,77 | ||||
| 2025-10-31 | 13F | NWF Advisory Services Inc. | 0 | -100,00 | 0 | |||||
| 2026-04-13 | 13F | Artemis Investment Management LLP | 195.370 | -12,30 | 3.569 | 31,21 | ||||
| 2026-02-09 | 13F | Hartland & Co., LLC | 0 | -100,00 | 0 | |||||
| 2026-02-17 | 13F | Captrust Financial Advisors | 18.677 | 59,92 | 228 | 64,03 | ||||
| 2026-04-24 | 13F | Strs Ohio | 19.400 | -69,40 | 354 | -54,26 | ||||
| 2026-02-13 | 13F | Pathstone Holdings, LLC | 0 | -100,00 | 0 | |||||
| 2026-02-17 | 13F | Epacria Capital Partners, Llc | 90.304 | -7,67 | 1.103 | -5,65 | ||||
| 2026-01-29 | 13F | Vanguard Group Inc | 973.749 | 17,13 | 11.889 | 19,68 | ||||
| 2026-02-05 | 13F | Amalgamated Bank | 4.252 | 2,93 | 0 | |||||
| 2026-02-11 | 13F | Zions Bancorporation, National Association /ut/ | 5.329 | 65 | ||||||
| 2026-02-17 | 13F | Delaware Management Holdings, Inc. | 401.767 | 4.906 | ||||||
| 2026-02-11 | 13F | Franklin Resources Inc | 107.379 | 72,78 | 1.311 | 76,68 | ||||
| 2026-04-20 | 13F | Ritholtz Wealth Management | 17.014 | -4,74 | 311 | 42,20 | ||||
| 2026-01-16 | 13F | Longboard Asset Management, LP | 0 | -100,00 | 0 | |||||
| 2026-02-04 | 13F | Bailard, Inc. | 48.700 | 0,00 | 595 | 2,24 | ||||
| 2026-02-10 | 13F | Connor, Clark & Lunn Investment Management Ltd. | 491.614 | 134,14 | 6.003 | 139,22 | ||||
| 2026-02-13 | 13F | Rhumbline Advisers | 175.842 | -11,86 | 2.147 | -9,90 | ||||
| 2026-02-13 | 13F | Morgan Stanley | 1.892.149 | -11,25 | 23.103 | -9,32 | ||||
| 2026-02-13 | 13F | Marnell Management LLC | 146.793 | 1.792 | ||||||
| 2026-02-10 | 13F | Globeflex Capital L P | 28.746 | 351 | ||||||
| 2026-02-12 | 13F | MetLife Investment Management, LLC | 72.883 | 1,38 | 890 | 3,49 | ||||
| 2026-02-19 | 13F/A | Axxcess Wealth Management, Llc | Call | 6 | ||||||
| 2026-04-20 | 13F | TrueMark Investments, LLC | 0 | -100,00 | 0 | |||||
| 2026-02-23 | 13F | Virtu Financial LLC | 58.504 | 1 | ||||||
| 2026-01-20 | 13F | Harbor Capital Advisors, Inc. | 1.456 | 130,74 | 0 | |||||
| 2026-04-20 | 13F | Hilton Head Capital Partners, LLC | 415 | 8 | ||||||
| 2026-04-16 | 13F | SG Americas Securities, LLC | 0 | -100,00 | 0 | |||||
| 2026-02-17 | 13F | Fmr Llc | 24.119.899 | 0,15 | 294.504 | 2,33 | ||||
| 2026-02-17 | 13F | Jump Financial, LLC | 34.095 | 416 | ||||||
| 2026-02-13 | 13F | Van Eck Associates Corp | 346.233 | 4 | ||||||
| 2026-02-17 | 13F | Cetera Investment Advisers | 19.755 | 11,03 | 241 | 13,68 | ||||
| 2026-02-10 | 13F | Rothschild Investment Llc | 354 | 25,98 | 4 | 33,33 | ||||
| 2026-02-17 | 13F/A | Uniplan Investment Counsel, Inc. | 243.159 | 59,25 | 2.969 | 62,72 | ||||
| 2026-02-09 | 13F | Kingsview Wealth Management, LLC | 357.982 | 61,02 | 4.371 | 64,53 | ||||
| 2026-02-11 | 13F | Prudential Plc | 20.877 | 255 | ||||||
| 2026-02-13 | 13F | MAI Capital Management | 1.756 | 485,33 | 21 | 600,00 | ||||
| 2026-04-21 | 13F | First United Bank Trust/ | 1.800 | 0,00 | 33 | 52,38 | ||||
| 2026-01-07 | 13F | Harbour Capital Advisors, LLC | 57.827 | -1,26 | 679 | 1,19 | ||||
| 2026-02-02 | 13F | Principal Financial Group Inc | 193.292 | 54,85 | 2.360 | 58,28 | ||||
| 2026-02-17 | 13F | Bridgeway Capital Management Inc | 1.184.149 | -4,12 | 14.458 | -2,03 | ||||
| 2026-02-11 | 13F | Parallel Advisors, LLC | 160 | 0,00 | 2 | 0,00 | ||||
| 2025-11-14 | 13F | Centiva Capital, LP | 0 | -100,00 | 0 | -100,00 |